Causal analysis in linear networks
In many areas of applied sciences it is natural to setup a network of data blocks that reflect the measurements of a large interconnected systems. In these models it is often useful to study which variables cause what. The direction of causality is supposed to be given by the person. The methods presented here are designed to simplify the structure of the loading matrix matrix P according to a given theory or derived from the data.
Topics
| 1. | Introduction. Ideas and methods. |
| 2. | One data block. Latent structure. |
| 3. | The H-method of estimation |
| 4. | Measures of causality |
| 5. | Plots of latent structure |
| 6. | Three data blocks |
| 7. | Estimation procedures |
| 8. | Cross-validation |
| 9. | Network of data blocks |
| 10. | Comparison of methods |
| 11. | Examples |
| 12. | Information measures |
| 13. | Correlation and prediction |
| 14. | Several input (exogenous) and output (endogenous) data blocks |
| 15. | Numerical methods |
| 16. | Increasing networks |
| 17. | Confidence intervals |
| 18. | Detection of special features |
| 19. | Sensitivity analysis |
| 20. | Useful measures of causality |
| 21. | Guidelines for presentation of results |
The type of approach chosen for these methods are briefly presented here.
The given data matrix X (N times K) is decomposed by some method into a product of a score matrix T (N times A) and a loading matrix P (K times A). Mathematically the decomposition can be written as
X = T PT + X0
Here X0 is the part of the X matrix that was not used in the analysis. The interpretation of the score matrix T is that the rows represents the 'scores' that the individuals have obtained. By simplifying the structure of P one will be able to explain better how the individuals obtain their scores. There are many algorithms that can be used, see an example of an approach.
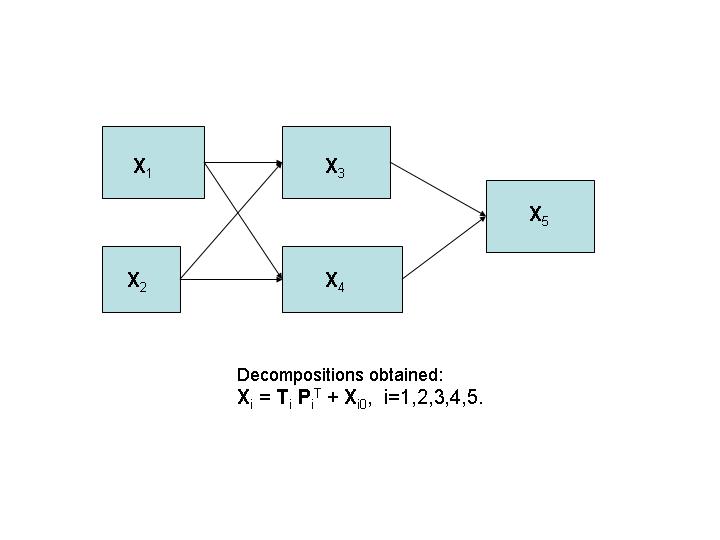
In a network of data blocks each data matrix, Xi, is decomposed in a similar way. And their structure is simplified in similar ways as in the case of one data block. The interpretation of the structure will then depend on the method chosen and its role in the network. An example of a network of data block is given in the figure below. It is given by 5 data blocks. The first two, X1 and X2, are the input (exogenous) data blocks.